Retention you decide
Ninety days by default, set to whatever you need in hours, days, weeks or years. Because ingest isn’t metered, keeping a year of metrics is a storage question rather than a billing one.

Managed Prometheus
A Prometheus-compatible endpoint that takes your metrics, keeps them as long as you say, and answers PromQL, so your dashboards, rules and alerts carry over unchanged.
Your infrastructure
No agent of ours deployed here.
Your ClusterNest cluster
Dedicated bare metal in Europe, kept as long as you say.
Your tools
Yours to choose and yours to run.
There’s no agent of ours to deploy and no format to convert to. If it speaks Prometheus remote write, version 1.0 or 2.0, and nearly everything does, it can write here. Local Prometheus servers can keep scraping exactly as they do now and forward the result, authenticated by the write password or by a token your own cluster already issues them.
remote_write:
  - url: https://metrics-42-cm.c9t.io/api/v1/push
    authorization:
      credentials_file: /var/run/secrets/tokens/metrics
    protobuf_message: io.prometheus.write.v2.Request
High availability
Metrics are what you reach for in an incident, so the store that holds them can’t go down with everything else. Every cluster is distributed from the start: each sample is stored on multiple replicas, so losing a machine costs no data and no downtime. Rule evaluation and alert delivery are shared across the replicas too, so a failure moves the work rather than stopping it.
On every tier
Every cluster runs its own rule evaluator and its own Alertmanager. Upload the rule groups you already have, route alerts to wherever your pages go today, and there’s nothing of yours to run in between.
name: checkout
rules:
  - alert: CheckoutErrors
    expr: |
      sum(rate(http_requests_total{code=~"5.."}[5m]))
        / sum(rate(http_requests_total[5m])) > 0.05
    for: 10m
    labels:
severity: pageNinety days by default, set to whatever you need in hours, days, weeks or years. Because ingest isn’t metered, keeping a year of metrics is a storage question rather than a billing one.
Trust your identity provider, or any Kubernetes cluster’s own service account tokens, and workloads push with the identity they already have. Tokens refresh on their own, and each grant names exactly who gets which access.
Write can push and never read back. Read-only can query and never push. Admin manages rules and Alertmanager. Hand each one only to what needs it.
The query API is Prometheus-compatible, so your existing rules, dashboards and alerts keep working. Nothing to port, no dialect to learn, and nothing an agent has to be taught before it can query your metrics.
Clusters accept remote write 2.0 as well as 1.0. It is still experimental upstream, but on two of our own clusters running the full kube-prometheus stack it cut egress by about two thirds.
Serve the endpoint on your own domain, and restrict it to the networks your workloads actually come from.
Rotate the credentials from the console, the API or Terraform, whenever you need to. No ticket, no coordination with us.
Reading it back
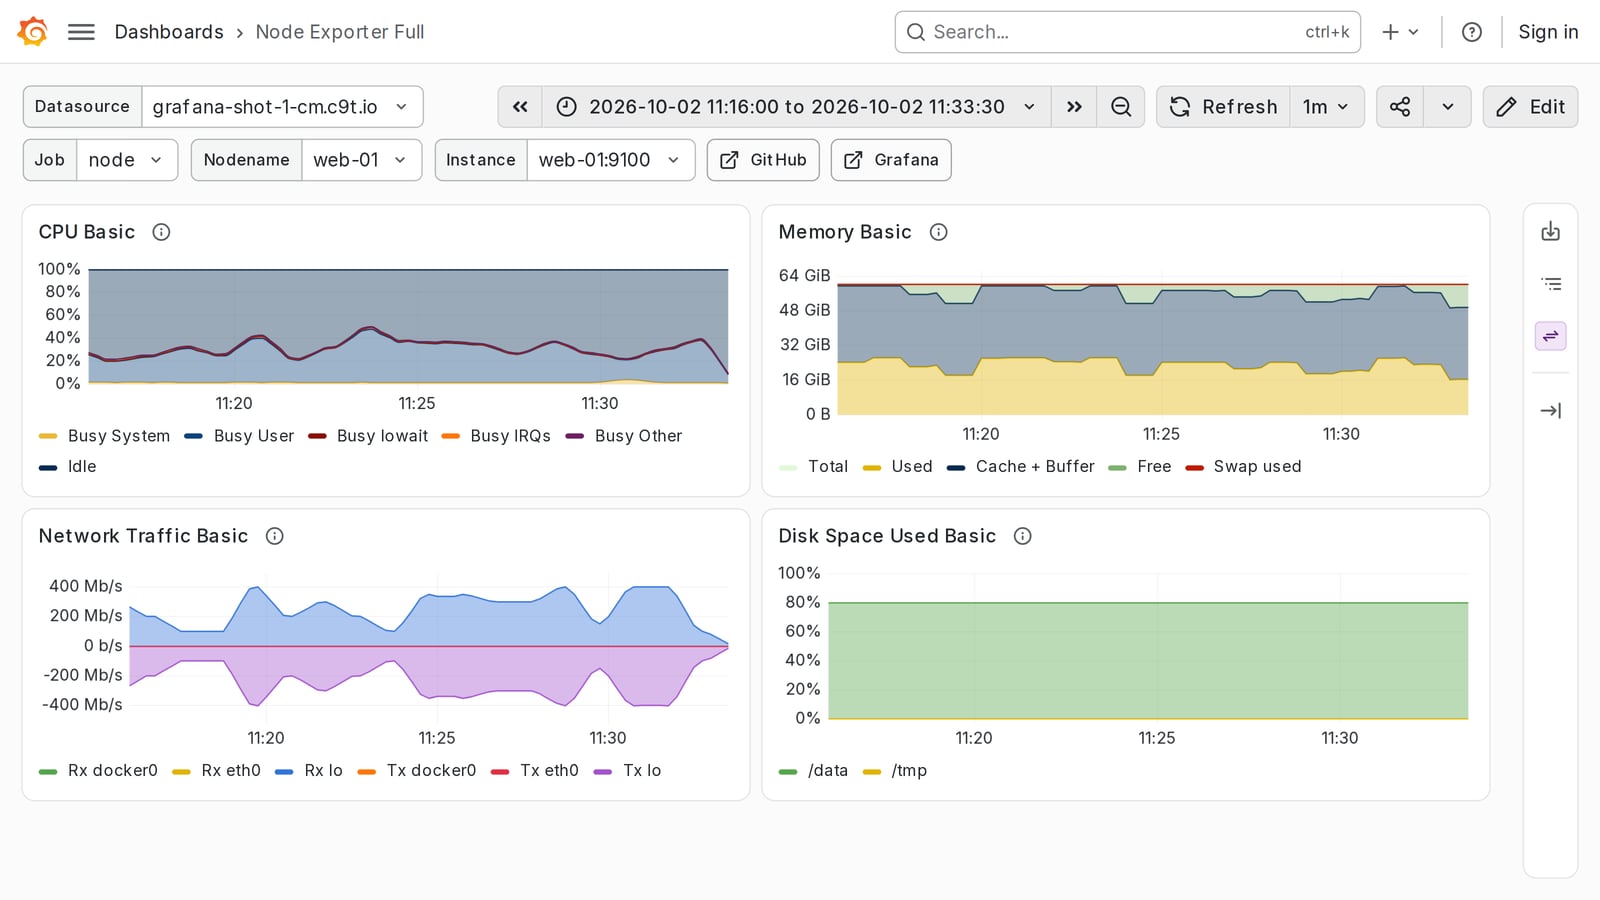
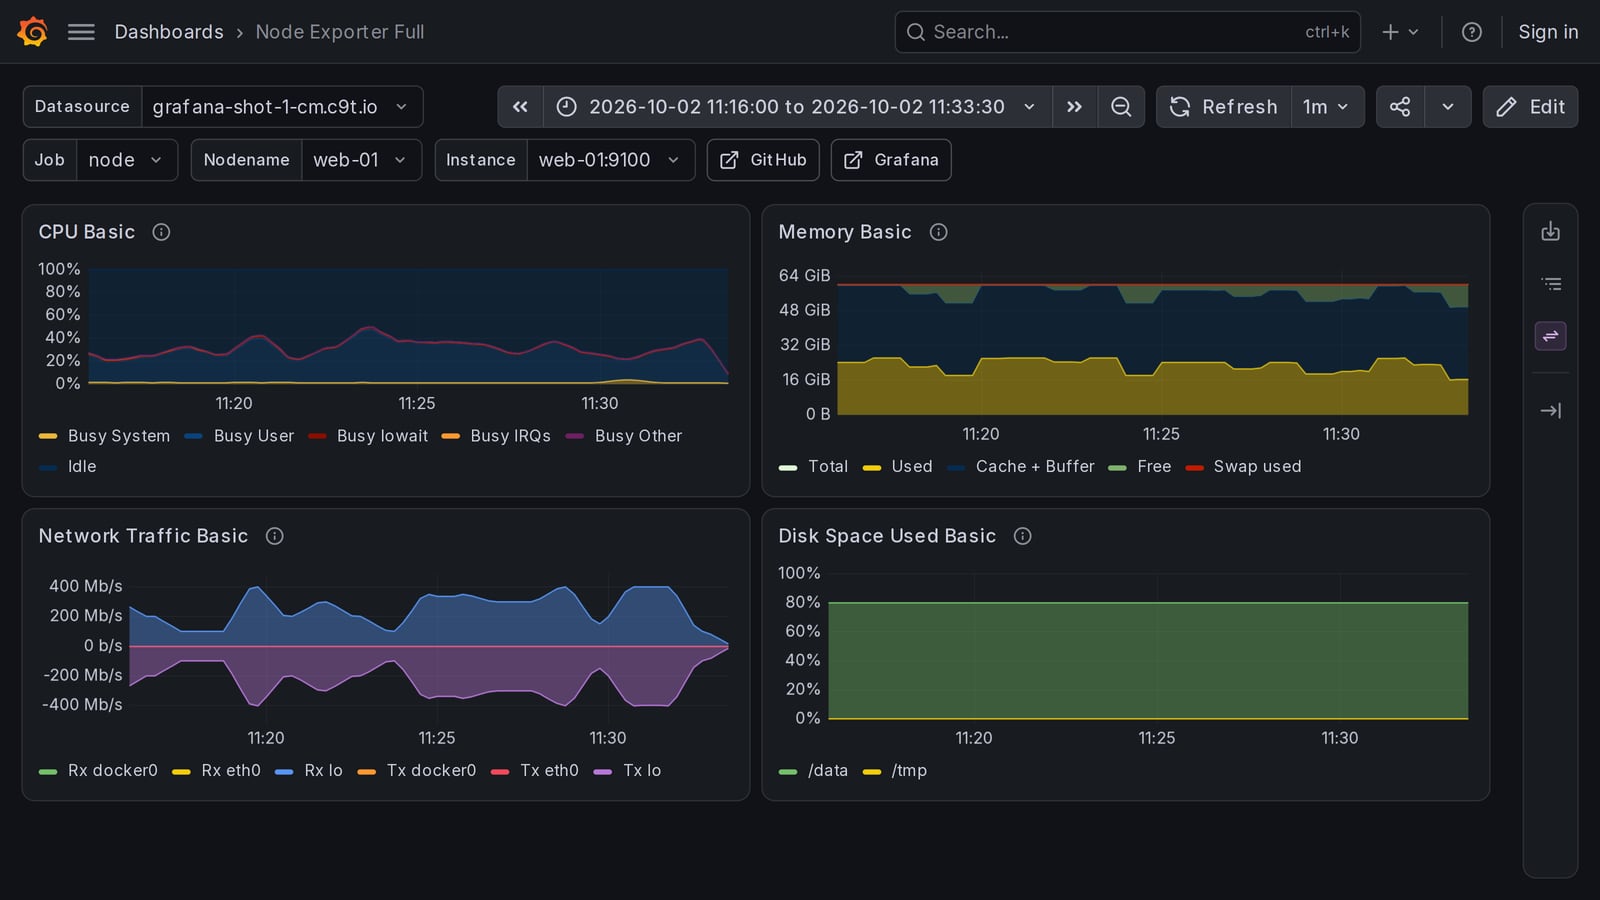
Add the endpoint as a Prometheus data source in Grafana with the read-only credential and everything you’ve already built keeps working. Recording and alerting rules are PromQL, so they transfer as they are.
Scale
| Tier | Per node | Nodes |
|---|---|---|
| Basic | 1 vCPU · 2 GiB · 10 GB NVMe | 3 |
| Standard | 2 vCPU · 16 GiB · 250 GB NVMe | 3 |
| Advanced | 8 vCPU · 64 GiB · 2 TB NVMe | 3–10 |
Priced per node, per month, exactly as OpenSearch is. Pricing
The storage engine is Cortex, which is why these version numbers don’t match Prometheus’s own. The API you talk to is Prometheus-compatible either way. New clusters default to 1.20.1.
Ten days on a Basic cluster, no card. Point a test Prometheus at it and see what the queries feel like.