The log store most teams run it for, plus search and analytics on the
same cluster. Provisioned, patched, backed up, upgraded and watched by
us, with Dashboards and coordinator nodes included at no charge.
Most teams come to us because their log bill grew faster than their
traffic did, and the fix on offer was to log less. Here, ingest isn’t
metered and queries aren’t counted, so the question goes back to
being how long the data is useful, not how much of it you can afford
to keep.
01
Ship
Fluent Bit, Logstash, OpenTelemetry, Filebeat, Vector: anything that speaks the OpenSearch or Elasticsearch bulk API. No proprietary agent to roll out across your fleet, and nothing to rewrite if you leave.
02
Keep
Index lifecycle policies roll indices through hot and warm and delete them on your schedule. Because ingest isn’t metered, how long you keep logs is an engineering decision rather than a budget one.
03
Find
Full-text search over every field, with PPL and SQL for people who think in pipelines or tables, and Discover in Dashboards for people who’d rather not write a query at all. Every one of those is a public language, so the coding agent on your team’s laptop queries the cluster as readily as they do.
04
Notice
Monitors run queries on a schedule and alert when a pattern appears or a rate moves. Anomaly detection catches the shifts nobody thought to write a rule for.
05
Protect
Snapshots to an S3 bucket you own, on a schedule you set. Your log history isn’t hostage to your account staying open.
Twice the throughput, half the price.
We ran OpenSearch Benchmark against a Standard cluster and the
matching Amazon OpenSearch Service cluster, from a test machine inside
AWS’s own region. Under the same load, ClusterNest indexed twice as
many documents a second and served 2.5 times the queries.
Highest bulk indexing rate each three-node cluster reached.Highest term query rate each cluster reached, with up to 64 parallel clients and the shard request cache off.
From our benchmark. AWS is 3 × r6g.large.search, Europe (Frankfurt)
at the lowest on-demand price for that configuration, checked
15 October 2026, before data transfer and coordinator nodes.
It isn’t only a log store.
Your own observability stack
Traces and APM alongside your logs, assembled the way you want it. Send OpenTelemetry data into the cluster, explore it with PPL in Dashboards, and alert on it in the same place. It’s a standard OpenSearch endpoint, so your pipeline is yours to choose.
Application search
The same cluster backs product search: full-text with the relevance controls you’d expect, plus k-NN and hybrid search for semantic and retrieval-augmented workloads on the same index.
Analytics
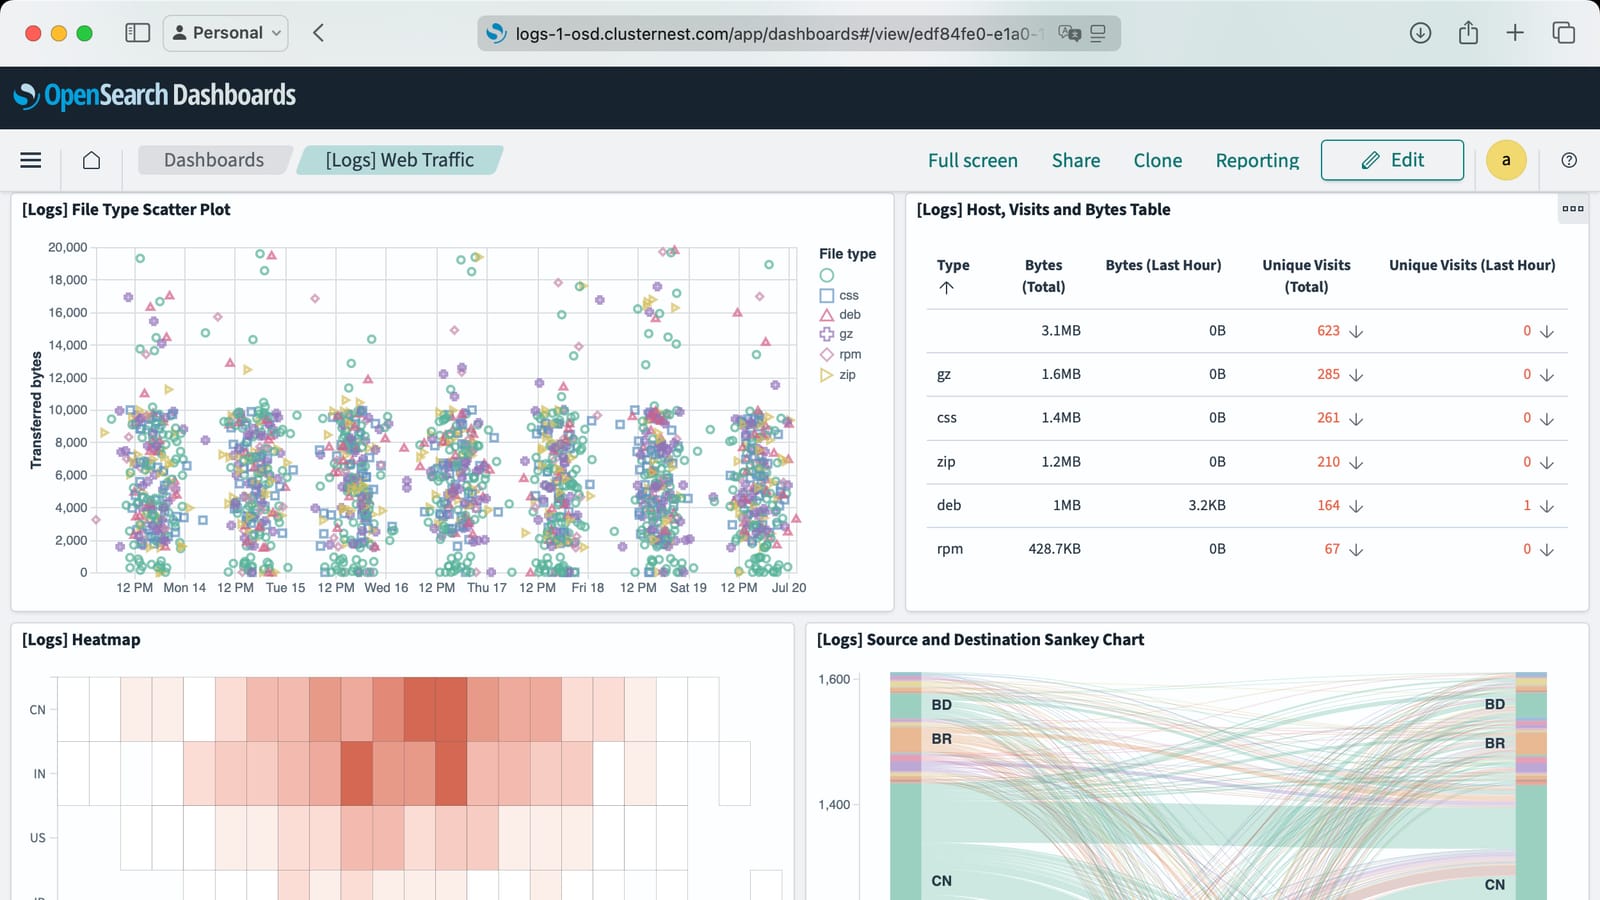
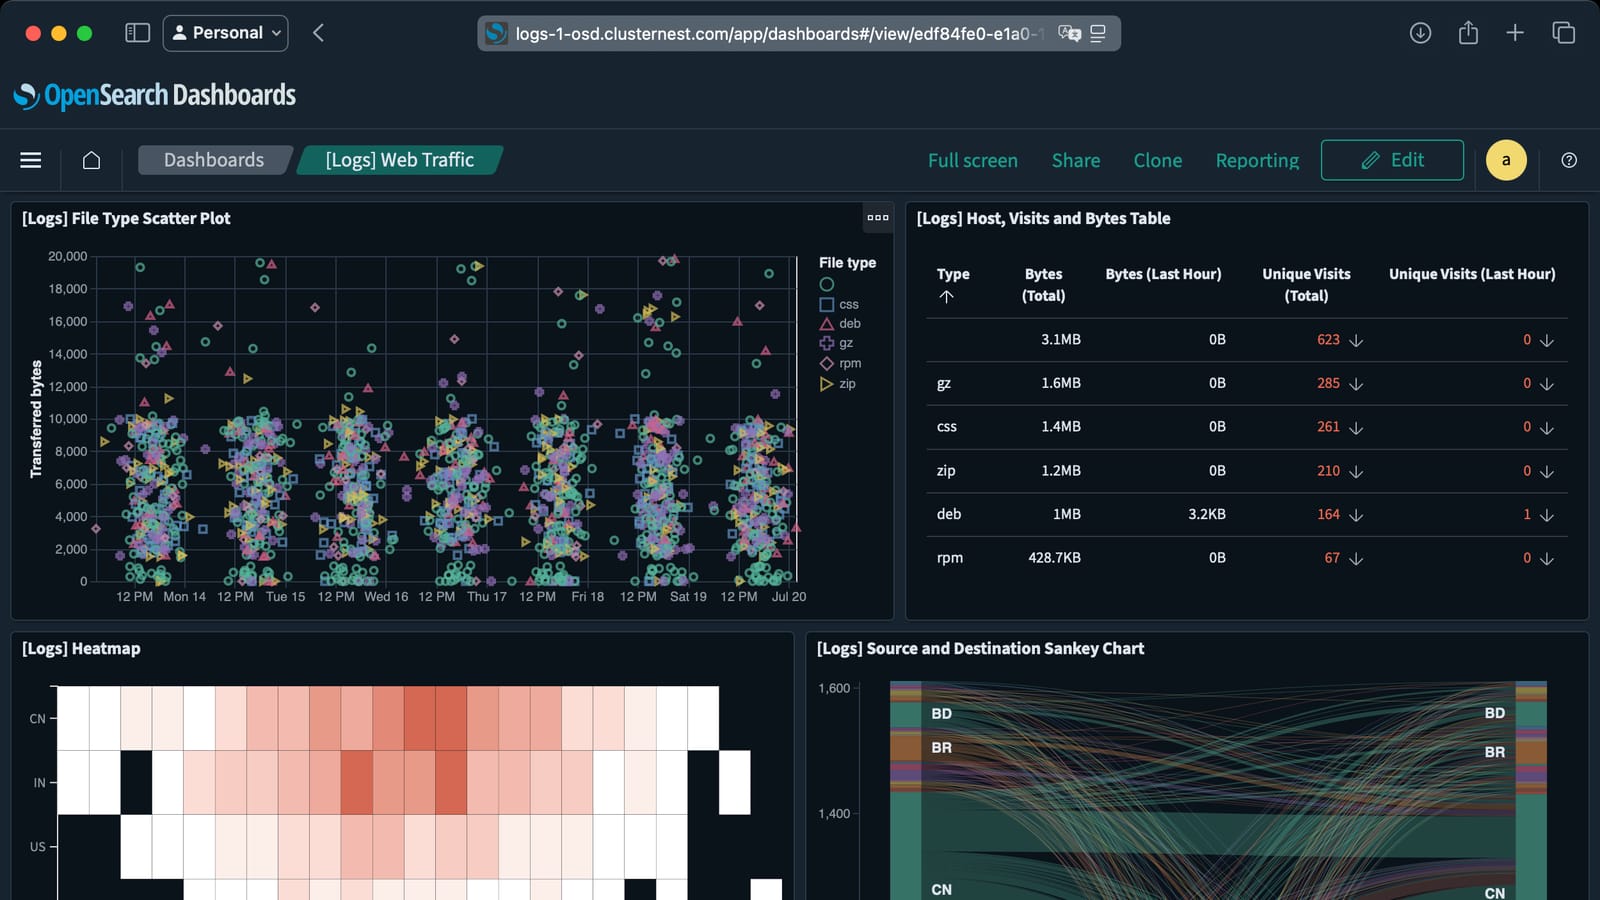
Aggregations over billions of documents, surfaced in Dashboards for people who will never open a query console. Dashboards is part of every cluster, not an add-on.
What "managed" means here
The work you stop doing.
Running OpenSearch yourself is not hard on day one. It gets hard on
the day a node fills up, a certificate expires, or a version reaches
end of life, usually at once. That’s the part we take.
You keep the cluster admin credentials, your data stays in open
formats, and snapshots go to a bucket you own. Managed doesn’t mean
locked in.
Provisioning: a production cluster in minutes, not a ticket queue
Version upgrades in place, when you choose to take them
Security patching across the cluster and the host
Automated snapshots, restore-tested
Health monitoring, with us paged before you are
Scaling data nodes without taking the cluster down
TLS certificates issued and renewed for your hostnames
Capacity headroom watched as your indices grow
Configured by you, not by a support ticket.
Single sign-on
Point the cluster at your identity provider over OIDC or SAML, or use OpenSearch’s own internal user database. Set per cluster, changeable later.
Snapshots to your own S3
Configure an S3 repository and snapshots land in a bucket you control. Your backups don’t live only where your vendor keeps them.
Custom hostnames
Serve the cluster and Dashboards on your own domains instead of the generated ones, with certificates handled for you.
IP allowlists per endpoint
The cluster and Dashboards take separate allowlists, so you can expose Dashboards to the office and the API to your workloads only.
Credential rotation
Rotate admin credentials from the console, the API or Terraform. No ticket, no downtime, no waiting on us.
Maintenance windows
Name a weekly window in UTC and maintenance happens inside it. Leave it unset and we work around your traffic instead.
Dashboards and coordinator nodes cost nothing.
You’re billed for data nodes. The coordinator nodes that route your
queries and the Dashboards instance you actually look at are part of
the cluster, not line items. That is not how the hyperscalers price
dedicated master nodes.
Scale
Tier
Per node
Data nodes
Basic
1 vCPU · 2 GiB · 10 GB NVMe
3
Standard
2 vCPU · 16 GiB · 250 GB NVMe
3
Advanced
8 vCPU · 64 GiB · 2 TB NVMe
3–10
Advanced is the only tier that scales past three nodes. Every node bills
at the same rate, so a cluster costs the node price times the node
count.
Dashboards on a running cluster, at its own address. Stock OpenSearch,
so anything you build here loads on any other OpenSearch.
9 minor lines, upgraded in place.
One entry per minor line, pinned to its latest patch, upgraded when
you choose to take it. 3.8 is the default for a new
cluster.
3.5 is absent deliberately. A regression in the security plugin broke cross-node requests, and upstream never shipped a fix for that line, so there was no build of 3.5 we’d stand behind.
3.0
3.1
3.2
3.3
3.4
3.5
3.6
3.7
3.8default
3.9
The questions that actually come up.
How do logs get into the cluster?
However you send them today. Fluent Bit, Logstash, the
OpenTelemetry Collector, Filebeat, Vector, or your own code
against the bulk API. The endpoint is standard OpenSearch, so
anything that writes to OpenSearch or Elasticsearch writes to it
unchanged. There is no ClusterNest agent to roll out and nothing
to unpick if you leave.
Point your shippers at the new endpoint and you’re taking new logs
immediately; that part is a config change. History moves by
snapshot restore or reindex-from-remote, and Kibana saved objects
mostly import into Dashboards, with the ones that don’t rebuilt by
hand.
If you’d rather not, we do it as an engagement covering index and
retention design, the migration itself, and dashboards and alerts
rebuilt on the other side.
Talk to us.
Do you have parsing for nginx, Apache and the rest?
The parsers live in your shipper, not in the platform, and Fluent
Bit and Logstash both ship with ones for the common web servers.
What’s ours is the index template on the other side: field types,
shard count, lifecycle policy. We’ll write that with you for your
log shapes rather than leaving you to discover it after a mapping
conflict.
Can we ship from AWS, GCP, Azure or our own racks?
All of them, and from several at once. The cluster is reachable
over HTTPS from anywhere you allow, and the endpoint takes its own
IP allowlist, so you can admit your production ranges and nothing
else. We don’t bill for data crossing the boundary in either
direction, though your cloud provider will bill you for what
leaves theirs.
Can you run this inside our own datacentre?
Not as the managed platform, which runs on our hardware. When the
cluster has to sit on your side of the line, that’s a consulting
engagement instead: we build it on your infrastructure and hand it
over, or keep operating it under a retainer.
Index and retention design, the migration itself, dashboards and
alerts rebuilt on the other side, and a retainer afterwards if you
want one. Quoted per engagement, on the same clusters everyone else
runs.