Logs
Managed OpenSearch
Ship from anything that speaks the bulk API. Search across every field, roll indices through lifecycle policies, and keep as much history as the data is worth.
Managed OpenSearch
Observability
Logs, metrics and traces on managed clusters with open interfaces. No proprietary agent, no per-gigabyte meter, and no vendor deciding what your pipeline looks like.
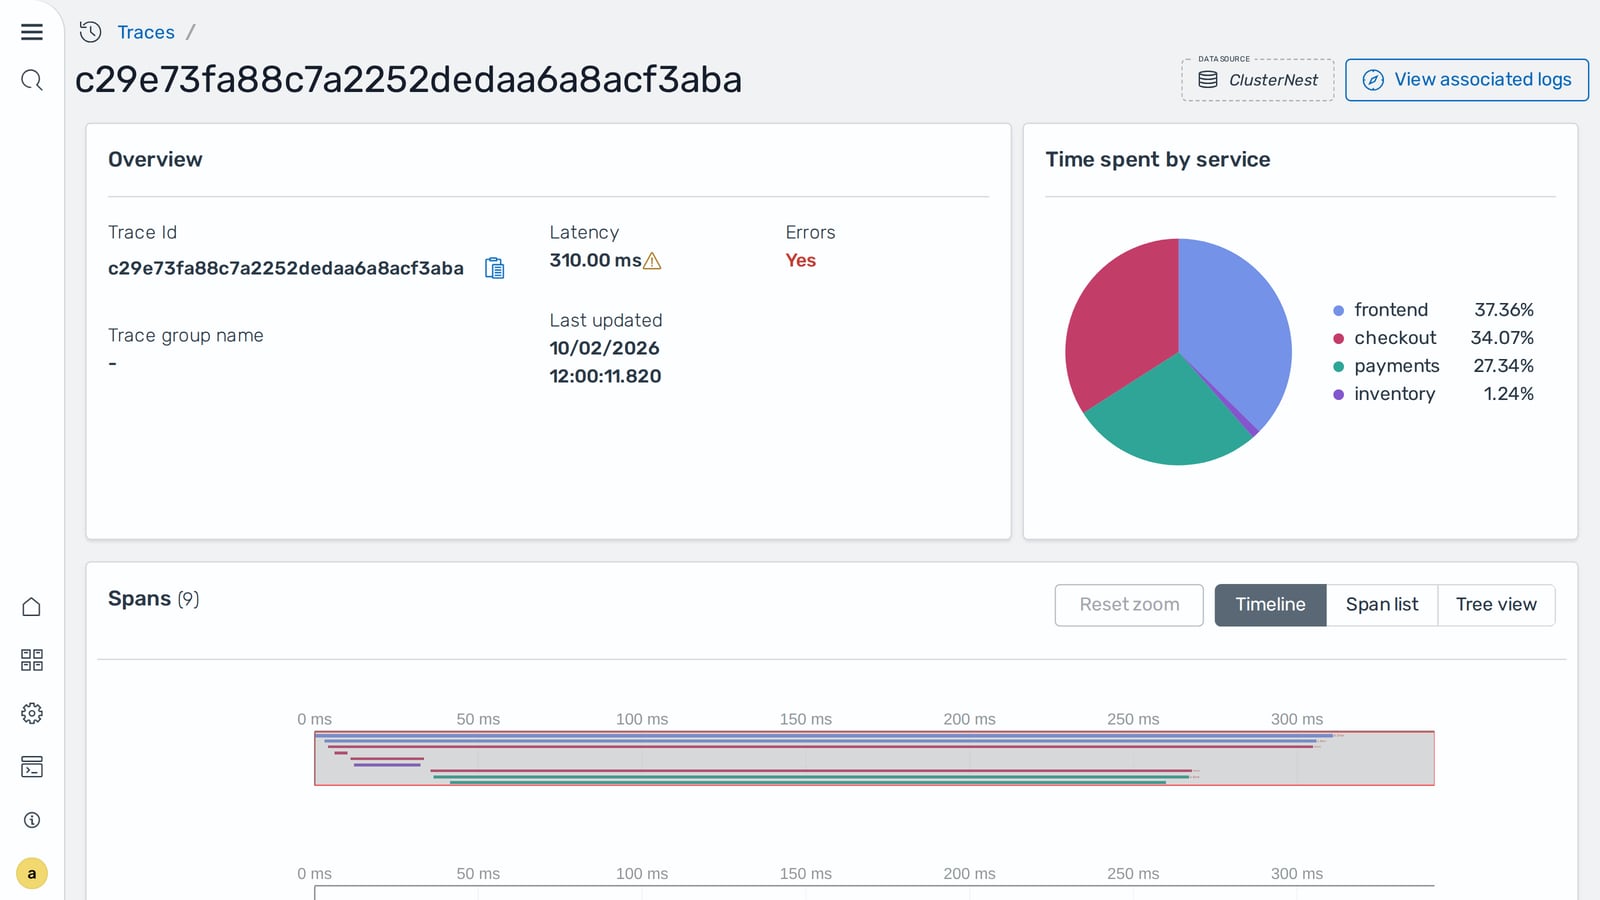
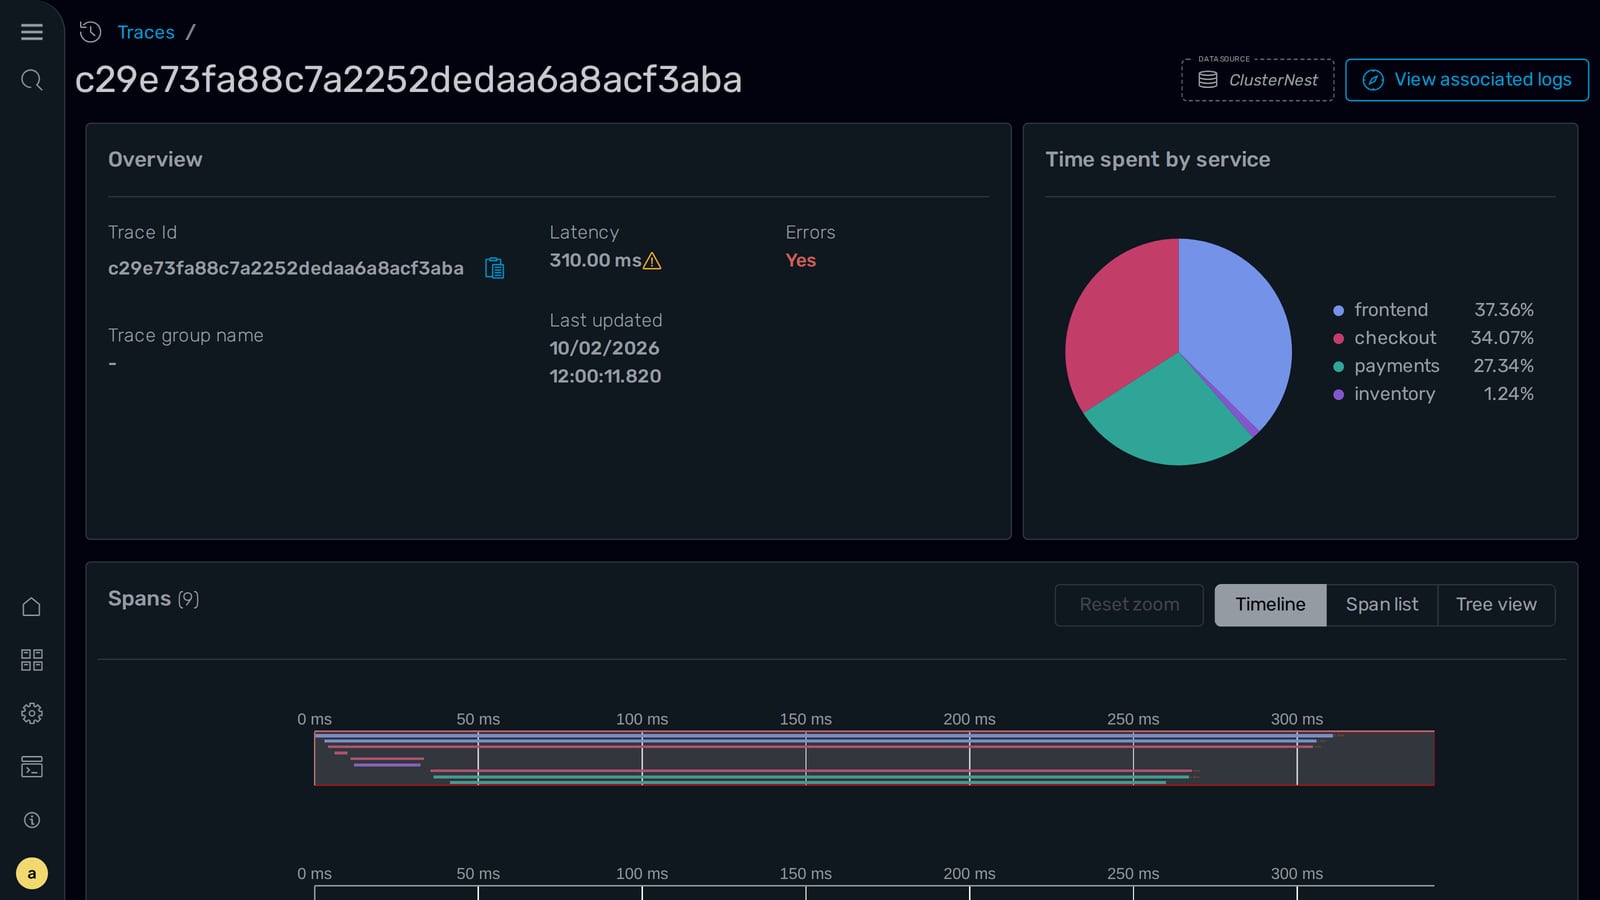
Logs and traces share a cluster because they answer questions together: you find the trace from the log line, and the log lines from the trace. Metrics sit in their own store because time series want different storage than documents do.
Logs
Ship from anything that speaks the bulk API. Search across every field, roll indices through lifecycle policies, and keep as much history as the data is worth.
Managed OpenSearchMetrics
Point remote_write at the endpoint and query with PromQL. Retention is yours to set, and your existing Grafana dashboards carry over untouched.
Managed PrometheusTraces
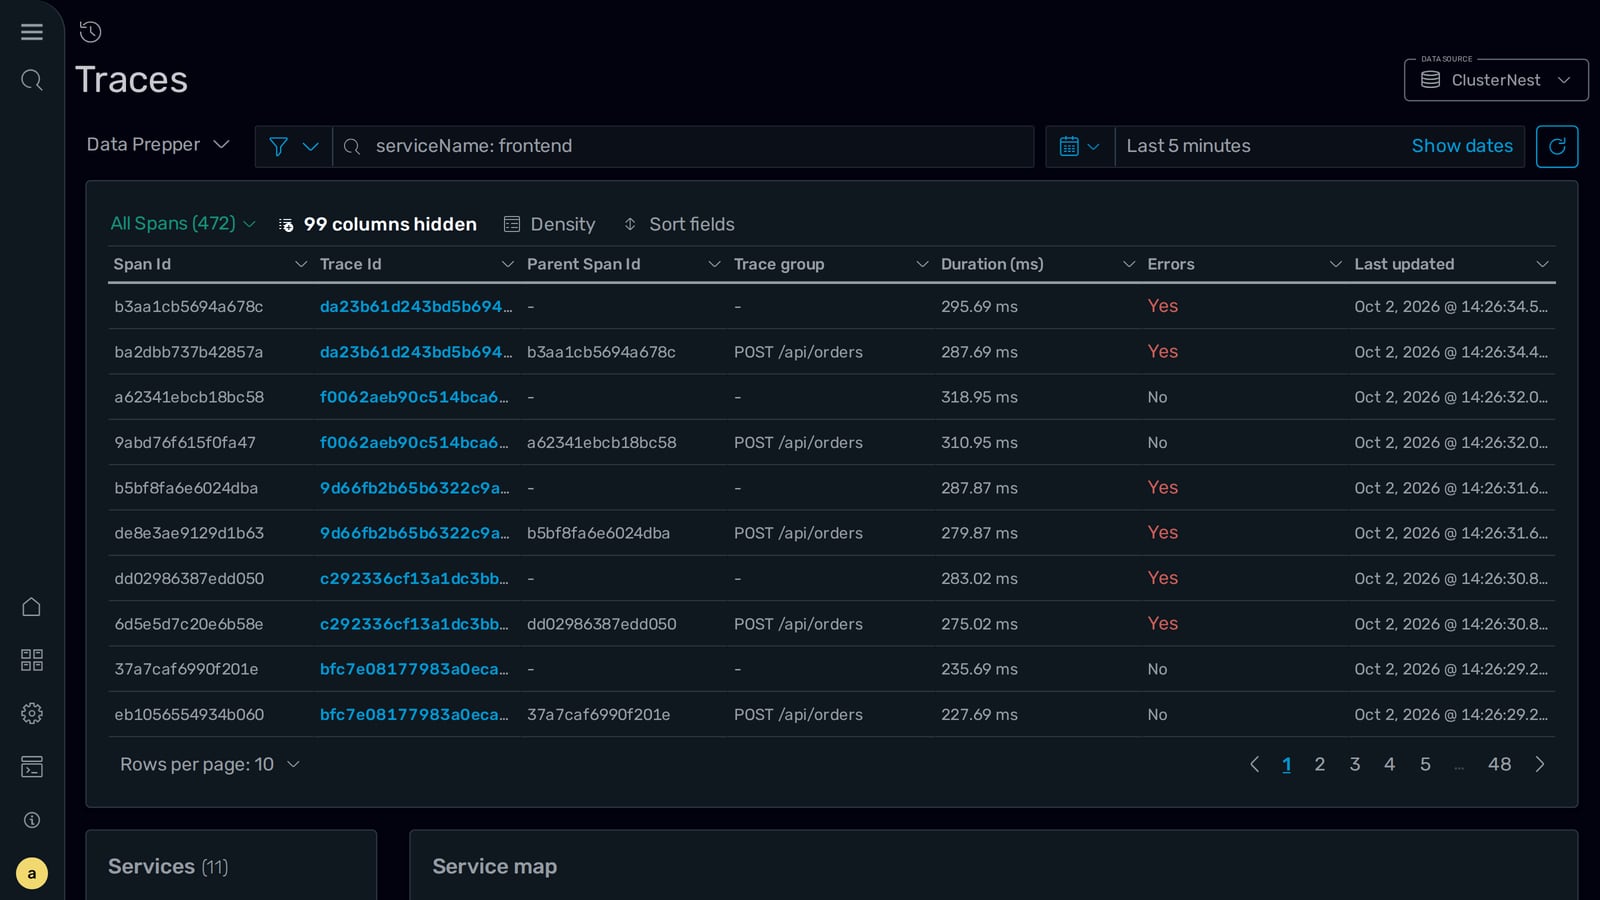
Send OpenTelemetry spans into the same cluster as your logs and explore them with PPL in Dashboards. Your collector, your pipeline, your schema.
Managed OpenSearch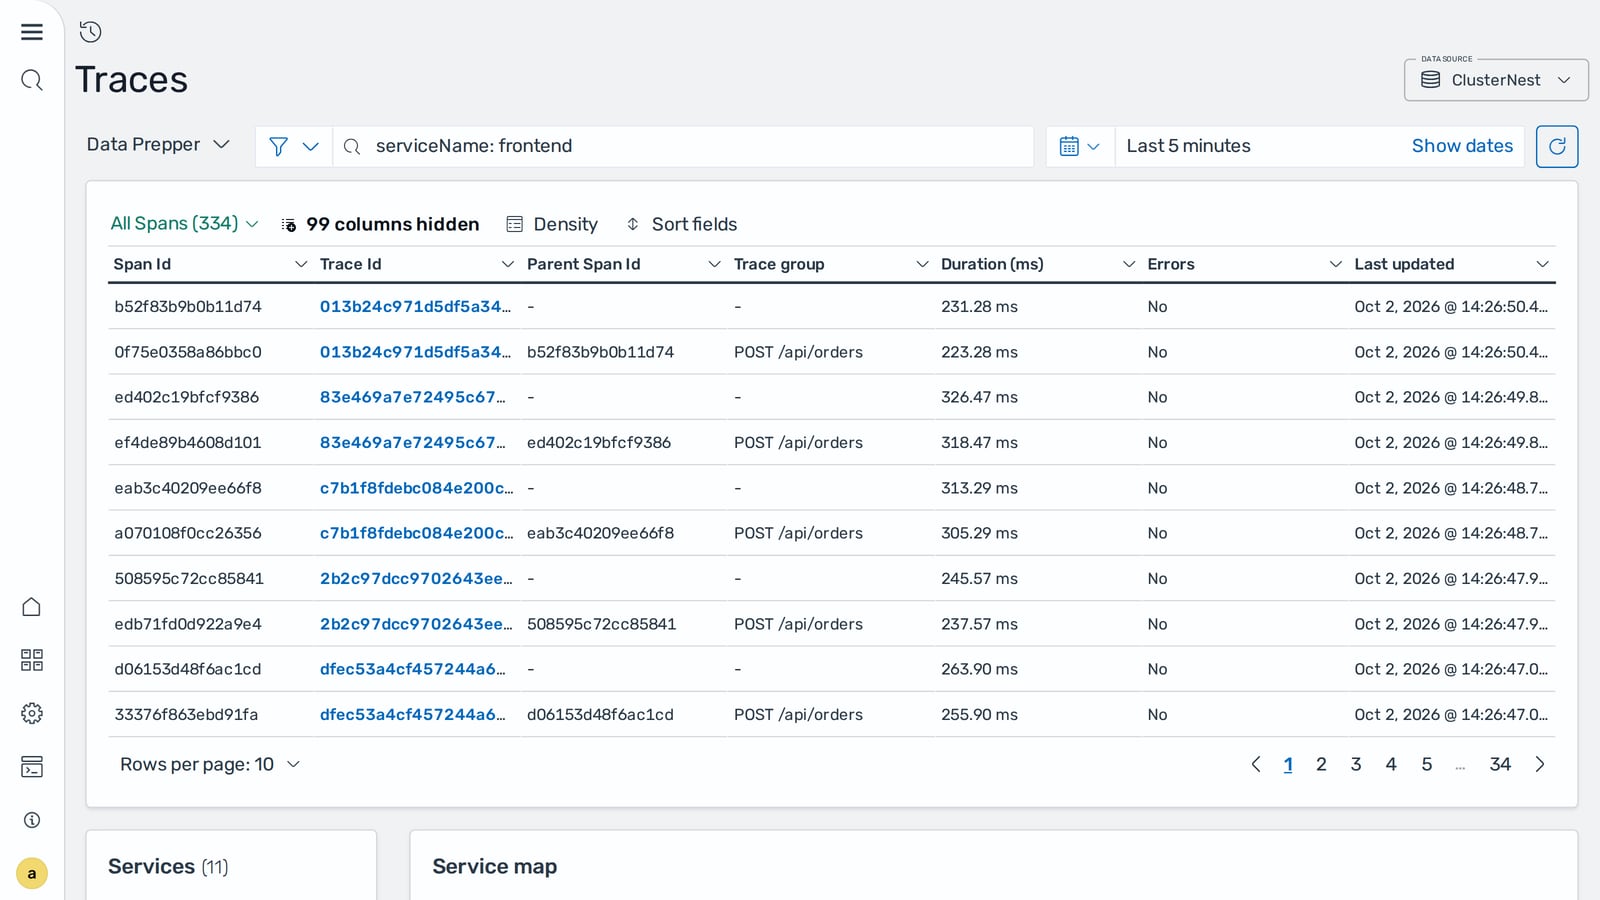
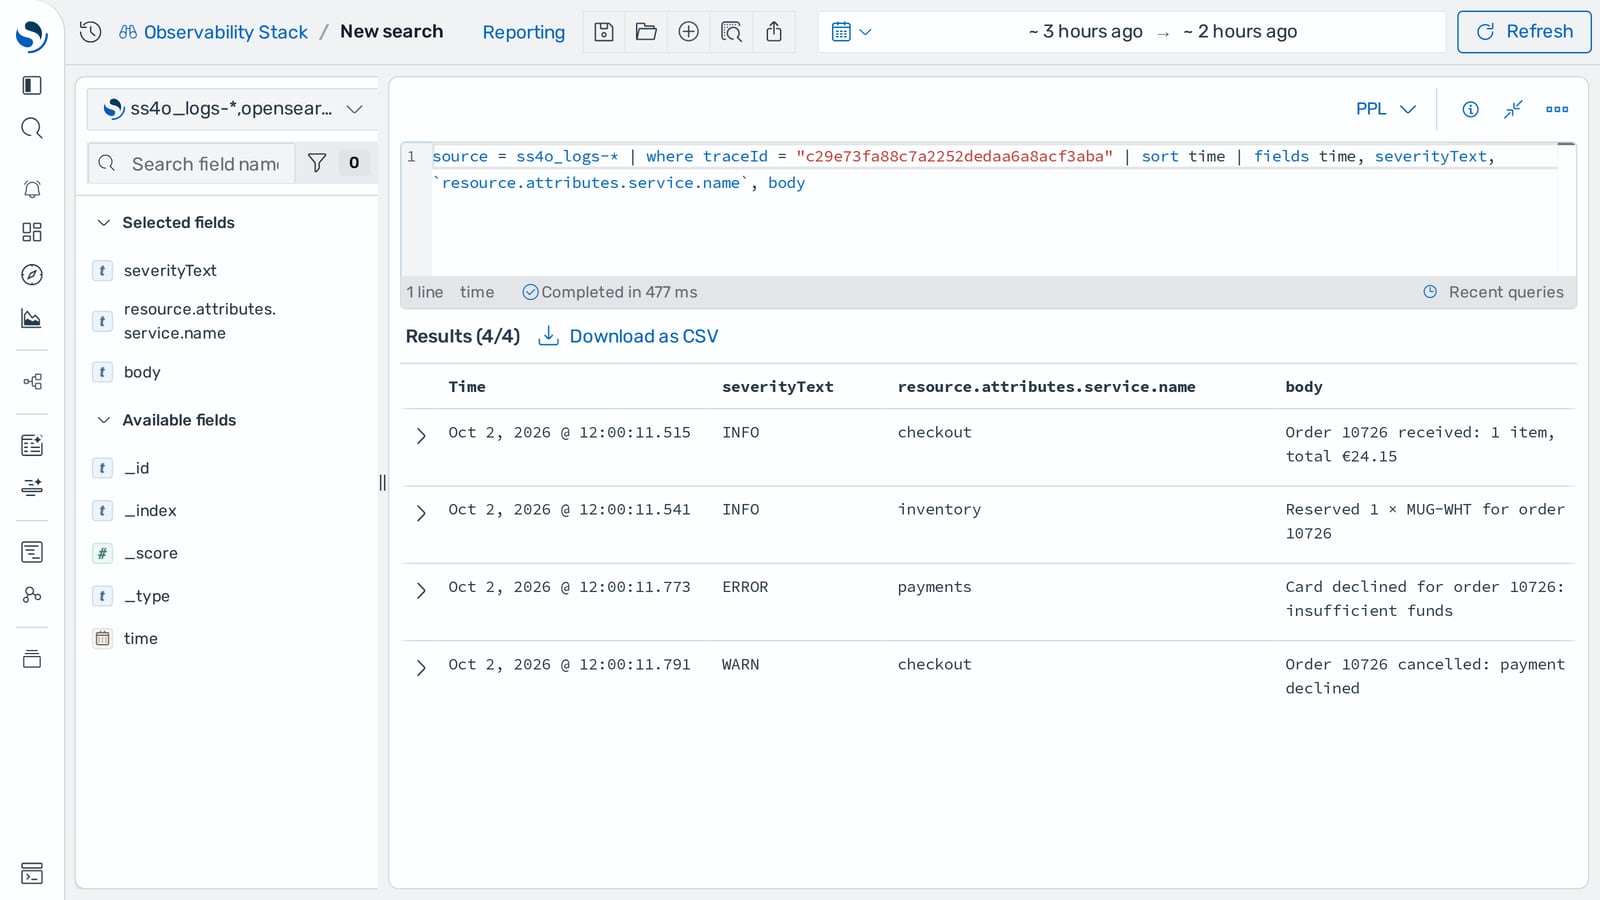
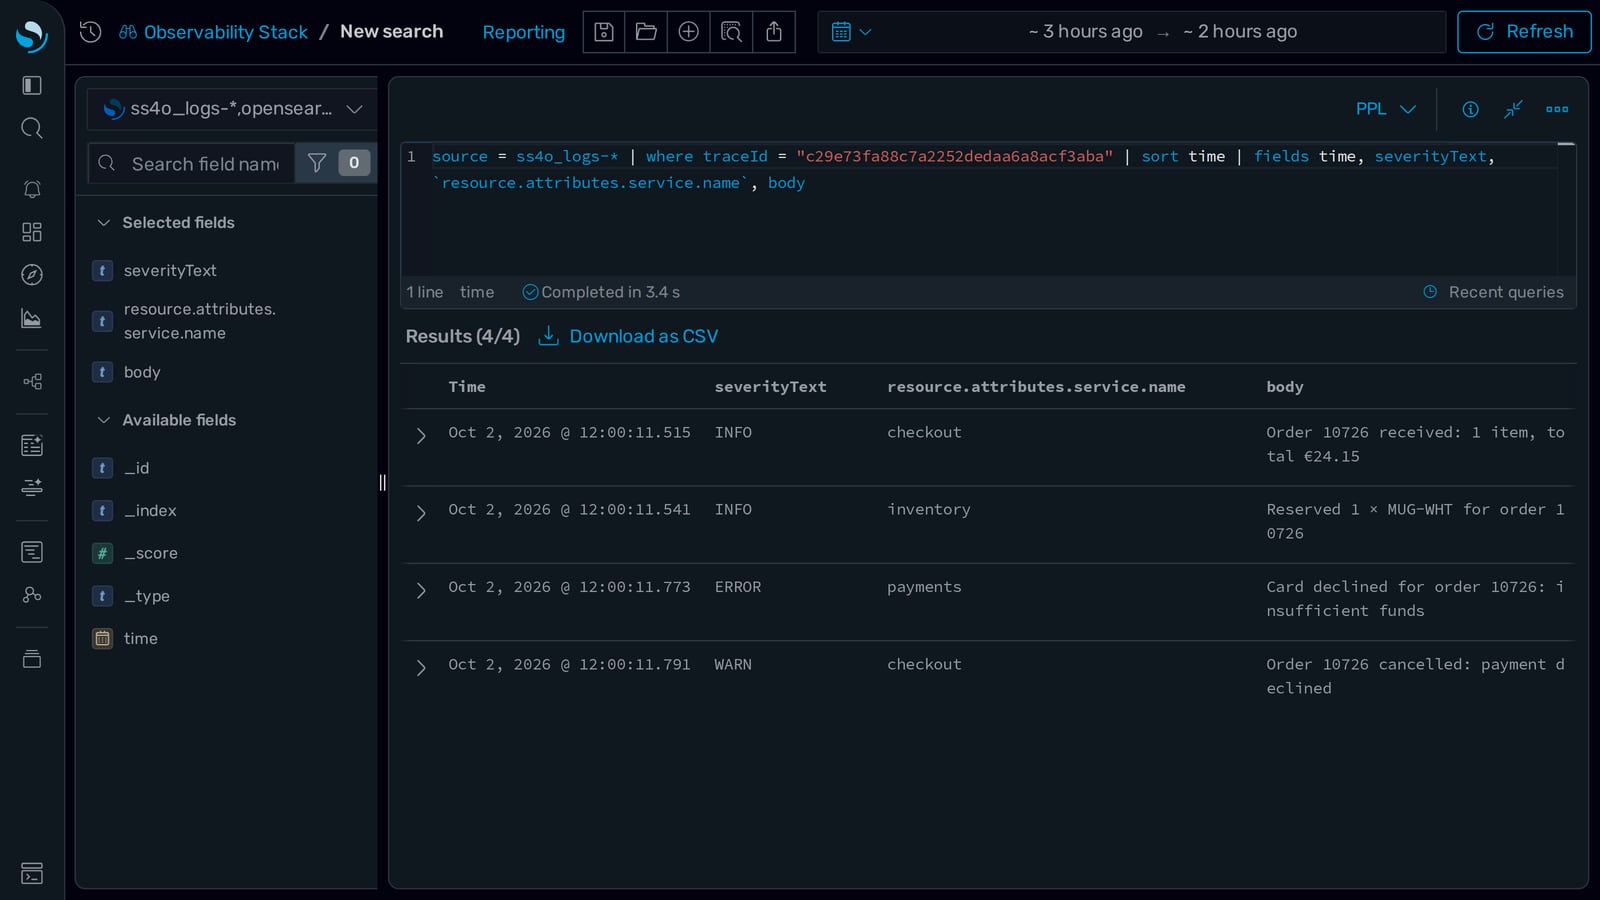
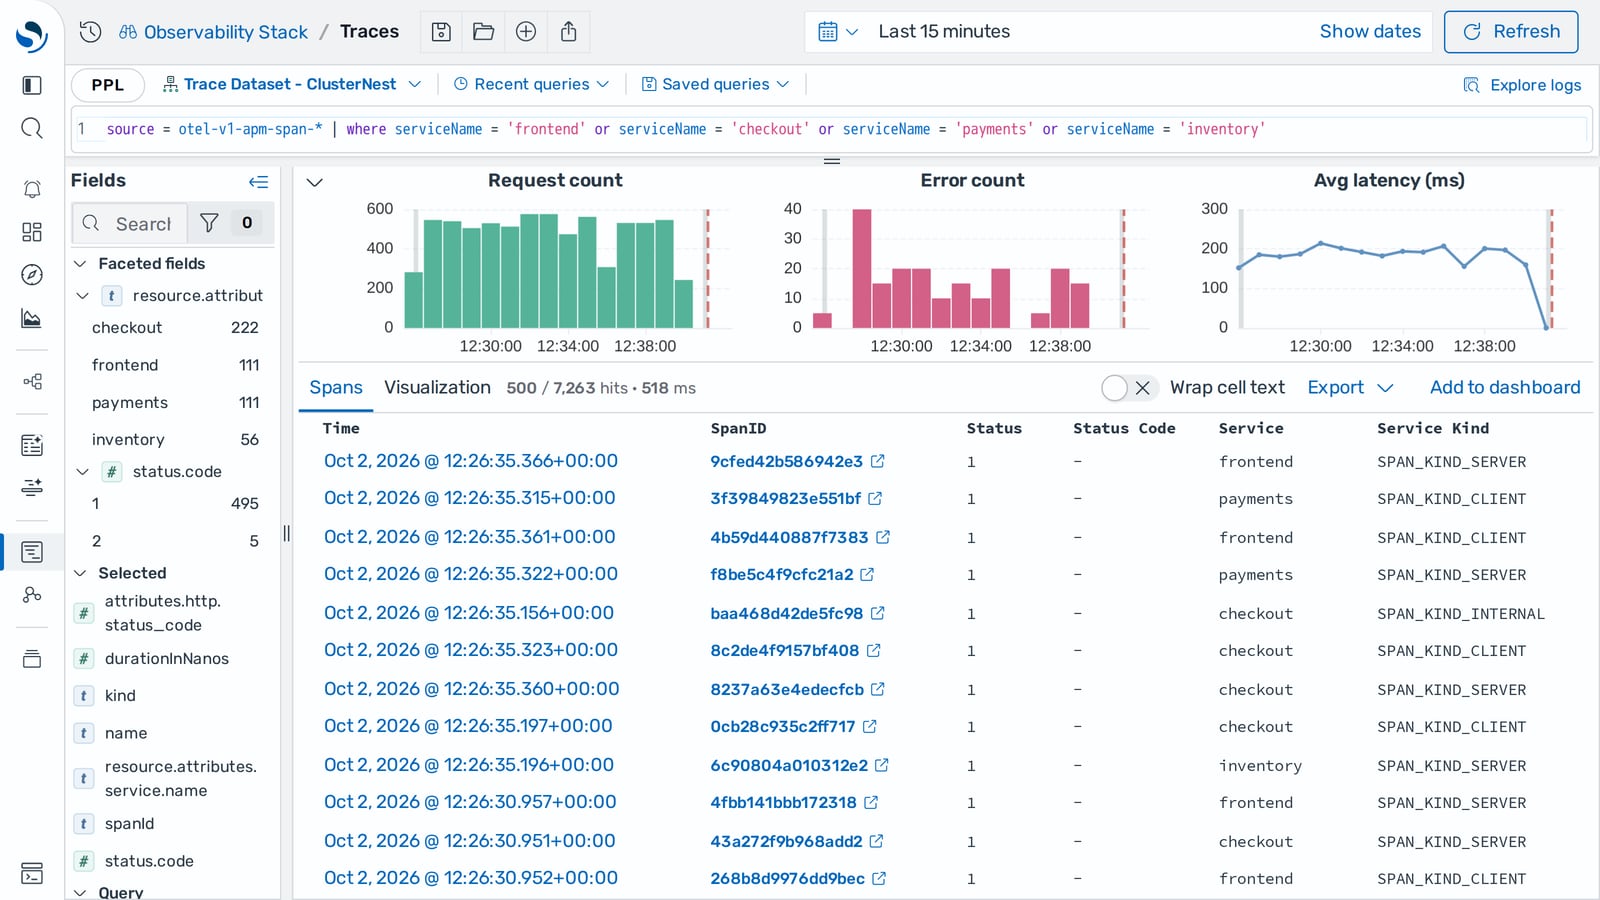
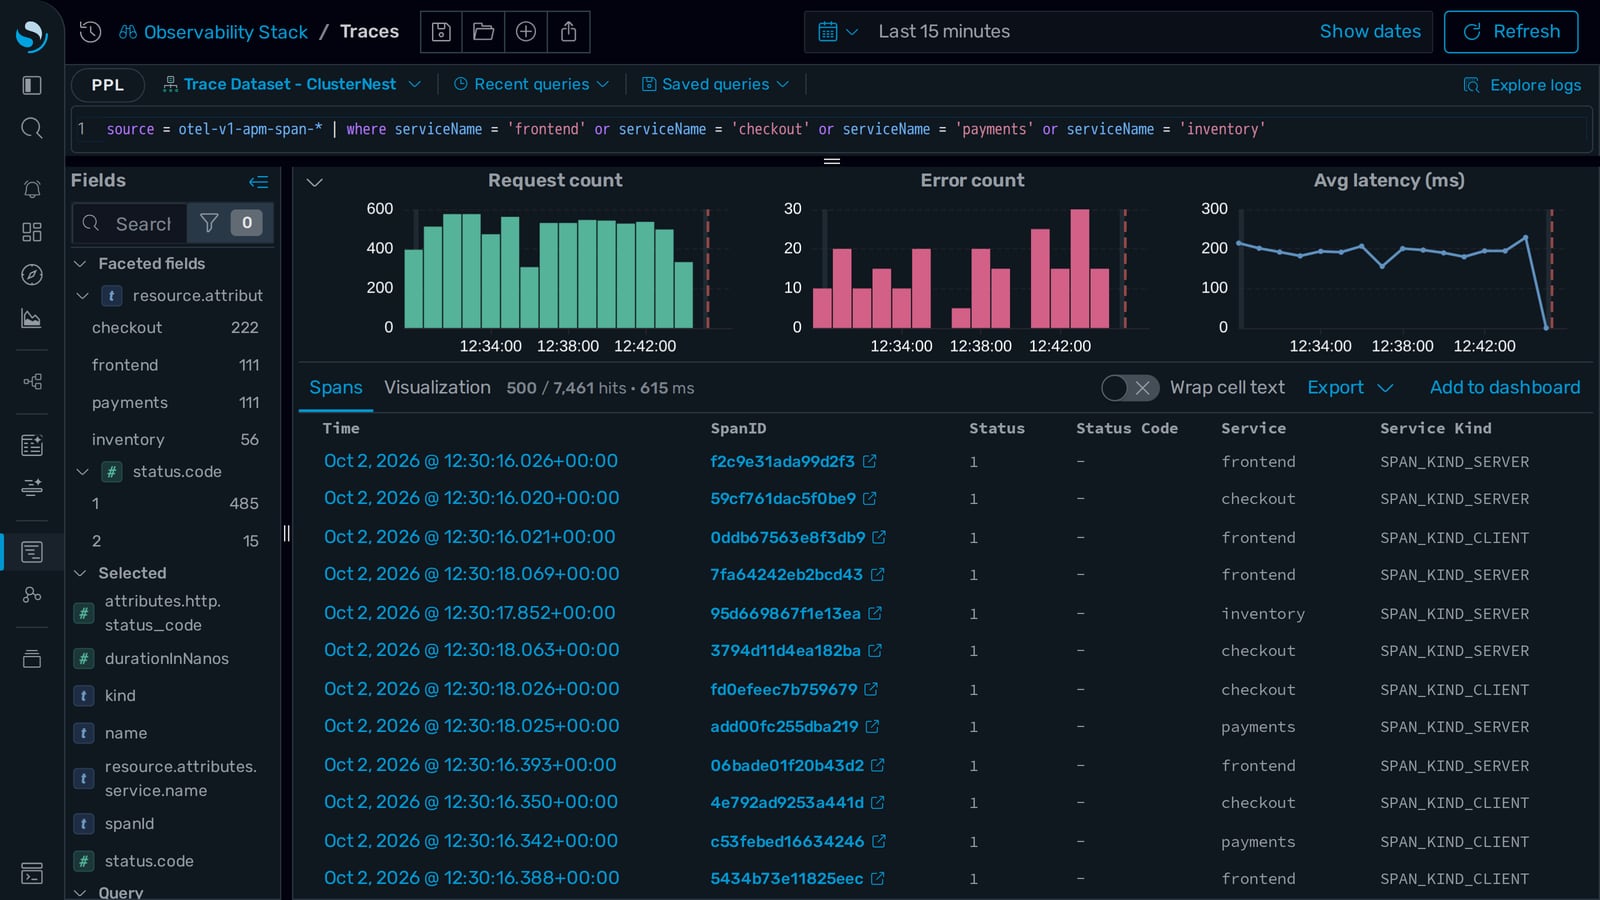
Observability architecture is opinionated work, and the opinions should be yours. We don’t ship an agent you have to adopt or a schema you have to conform to. The clusters present standard interfaces and what you send them is up to you.
Running the stores underneath is undifferentiated work that still wakes people up. That part we take, on both clusters, at a price that doesn’t move with your data volume.
Why it stays affordable
Metered observability quietly changes engineering behaviour: teams sample traces harder, drop log levels, and shorten retention, not because the data stopped being useful, but because it got expensive. The debugging you can do afterwards shrinks with it.
Per-node pricing removes that pressure. You decide what to keep on the merits, and the bill only changes when you add a node.
Your agents, too
Both engines are industry standards, so the models your team already uses can write working PromQL and OpenSearch queries against your data on day one. There’s no in-house query language to teach an agent and no proprietary integration to wait for.
Why that holds for the API tooTen days free on a Basic cluster. Most teams start with logs, add metrics once the log bill stops being the problem.