
Managed Prometheus is generally available
Managed Prometheus is out of beta, and it’s a different service from the one that went in. Every cluster is distributed and highly available, alerting is built in, remote write 2.0 cut the egress of two of our own clusters by about two thirds, and your workloads can push metrics without a single static credential.
A year ago we opened the beta and asked you to tell us what broke. Thank you to everyone who did. Four things came out the other side, and each of them deserves its own headline.
Built to stay up
Metrics are what you reach for when something else is on fire, so the metrics store is the one thing that can’t be down at the same time. Every cluster, on every tier, is now distributed:
- Every sample is written to multiple replicas. Lose a machine and you lose no data. The endpoint keeps taking writes and answering queries while it’s gone.
- Maintenance takes one replica at a time, so upgrades and node work never take the cluster down with them.
- Older data moves to durable object storage, where it doesn’t depend on any single replica staying alive.
- Rule evaluation and alert delivery are sharded across the replicas, so a failure moves the work rather than stopping it, and an alert fires once rather than once per replica.
Clusters run on Cortex, a horizontally scalable Prometheus-compatible store, which is what makes all of that possible. The API you talk to is still plain Prometheus, so none of it changes anything on your side. On the Advanced tier, a cluster scales out further still.
Alerting, built in
A metrics store you can’t alert from is half a monitoring stack. Every cluster now runs its own rule evaluator and its own Alertmanager, so the whole loop from sample to page lives in one place, with nothing for you to run.
Your rule groups upload as they are, in the YAML you already write:
name: checkout
rules:
  - alert: CheckoutErrorRate
    expr: |
      sum(rate(http_requests_total{job="checkout",code=~"5.."}[5m]))
        / sum(rate(http_requests_total{job="checkout"}[5m])) > 0.05
    for: 10m
    labels:
      severity: page
curl -X POST -u "admin:$ADMIN_PASSWORD" \
-H "Content-Type: application/yaml" \
--data-binary @checkout.yaml \
https://metrics-123-cm.c9t.io/api/v1/rules/productionRecording rules work the same way, so expensive queries can be precomputed once instead of on every dashboard refresh.
Routing is a standard Alertmanager config: PagerDuty for the pages, Slack for the warnings, a webhook for whatever else you run. The Alertmanager UI is served from the cluster too, for browsing what’s firing and silencing it during a deploy. The rules and their live state show up in Grafana through the same data source as your dashboards, so on-call sees one picture.
The rules API is admin-only, and it pairs naturally with the credentials section below: a CI job can hold a token that grants admin and ship your rule groups on every merge, with no password stored anywhere.
Remote write 2.0, and a smaller egress bill
Clusters now accept Prometheus remote write 2.0 as well as 1.0. Upstream still marks 2.0 experimental. In our hands it works better than that label suggests, and the difference shows up where you pay for it: egress.
The 2.0 protocol sends each series’ labels and metadata once and refers back to them, instead of repeating them in every request. A cluster running the full kube-prometheus stack has thousands of series that all carry long, repetitive label sets, so that is a lot of bytes that no longer have to leave the building.
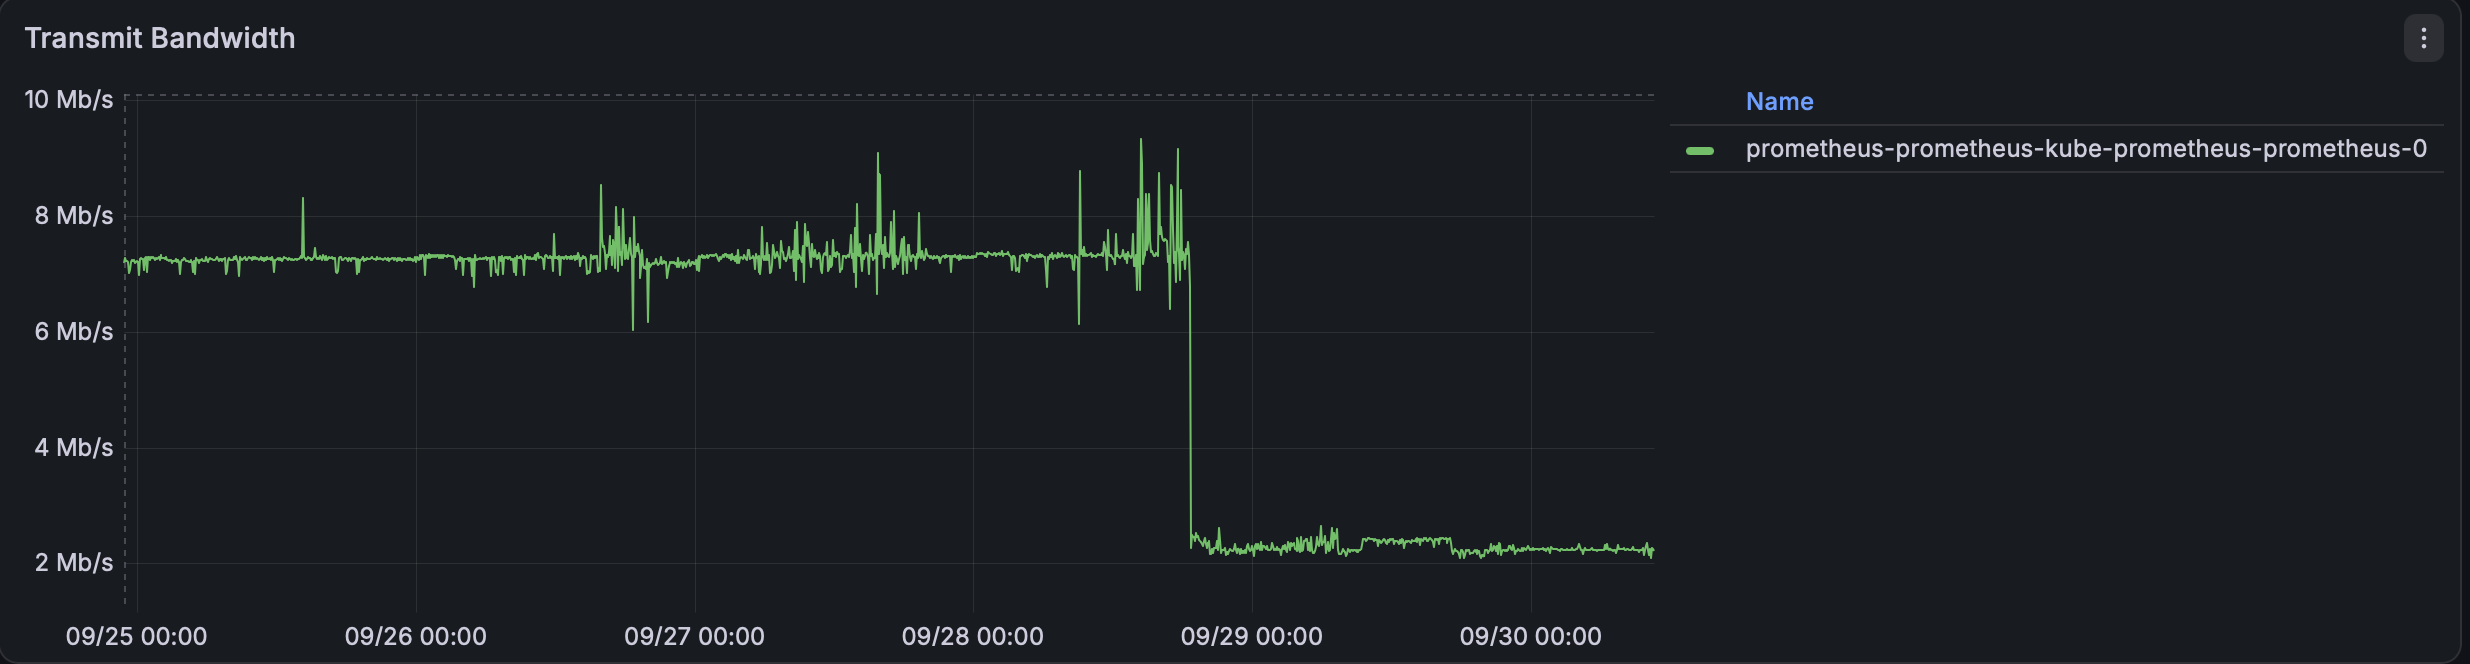
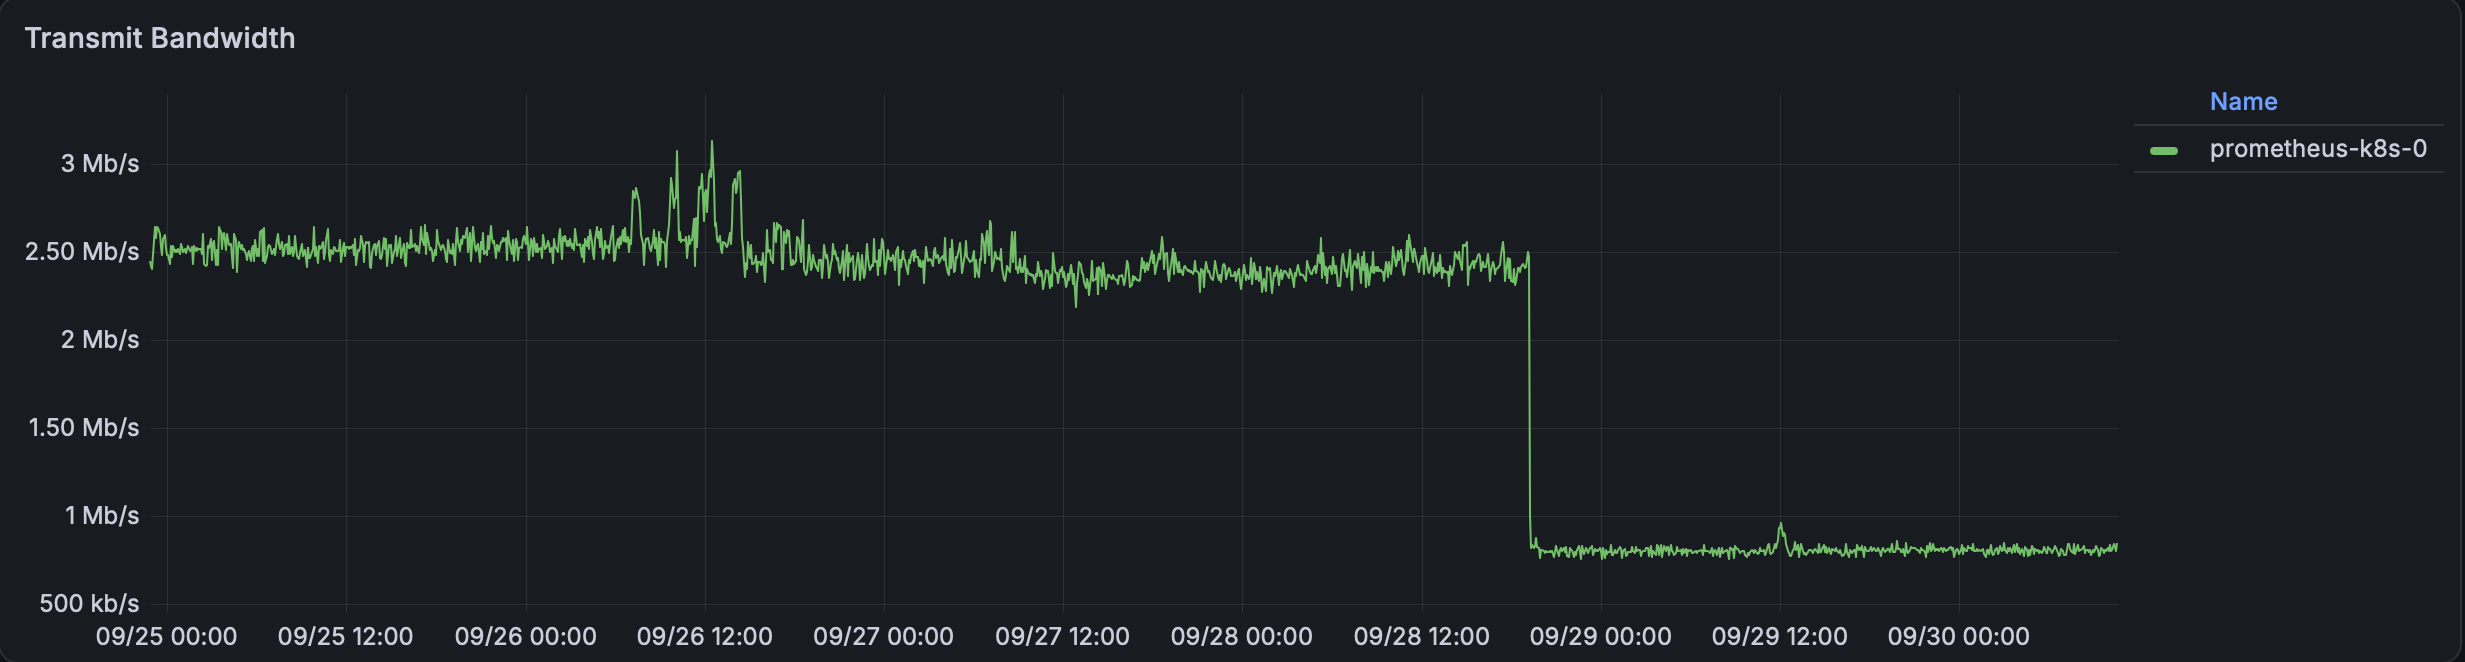
We moved two of our own clusters over, each running kube-prometheus in full. Both dropped by about two thirds the moment they switched, and stayed there.
It is one setting on the remote_write block:
remote_write:
  - url: https://metrics-123-cm.c9t.io/api/v1/push
    protobuf_message: io.prometheus.write.v2.Request
With the Prometheus Operator, the equivalent is messageVersion: V2.0 on the remote write entry. You need Prometheus 2.54 or later. It is still experimental upstream, so try it on a non-production Prometheus first.
No static credentials
Every metrics pipeline has the same awkward secret in it. A password sits in a Kubernetes Secret in every cluster that ships metrics, it never gets rotated because rotating it means touching all of them at once, and it outlives the engineer who created it.
That secret is now optional. A cluster can trust a JWT issuer directly through jwt_auth_sources, and a token from that issuer is a credential. Point it at your OIDC identity provider, or at the apiserver of any Kubernetes cluster you run, and workloads authenticate with tokens that are minted, refreshed and expired for you.
For Kubernetes it’s three moves. Trust the cluster’s issuer:
resource "clusternest_prometheus" "metrics" {
  name            = "metrics"
  tier            = "standard"
  organization_id = 123

  jwt_auth_sources = [{
    name               = "eks-prod"
    issuer             = var.eks_issuer
    oidc_discovery_url = var.eks_discovery_url
    audiences          = ["metrics"]
    grants = [{
      role = "write"
      claims = {
        sub = "system:serviceaccount:monitoring:prometheus"
      }
    }]
  }]
}
Project a token for that audience into the Prometheus pod, then hand remote_write the file:
remote_write:
  - url: https://metrics-123-cm.c9t.io/api/v1/push
    authorization:
      credentials_file: /var/run/secrets/tokens/metrics
    protobuf_message: io.prometheus.write.v2.Request
Done. The kubelet refreshes the token, Prometheus rereads the file on every request, and there is nothing left to leak. The grant above lets exactly one service account in one namespace write, and nothing else. A token that verifies but matches no grant gets a 403.
Grants come in the same three roles as the built-in credentials, and changes take effect within seconds, with no restart. The JWT federation guide walks through the full EKS setup, and the same steps apply to any conformant Kubernetes cluster.
If you’d rather keep passwords, those are scoped now too. write can push and can’t read anything back, readonly can query and can’t push, and admin manages rules and Alertmanager. A leaked shipper credential no longer exposes your metrics.
Still priced by the cluster
None of this changes the bill. There is no charge per series, per sample, per query or per alert, so adding a label is an engineering decision again rather than a budget one. And if your own network bill counts bytes out, remote write 2.0 shrinks that one too. You pay for the tier, the same way you do for OpenSearch, and the pricing page shows the whole thing.
Go and try it
Every new account gets ten days on a Basic cluster with no card. Create one in the console, through the Terraform provider, or ask your agent to do it over MCP. Point a Prometheus at it, upload your rules, switch on remote write 2.0, and delete a password.
Tell us what you build: [email protected].